Today we will see a new tool called "Grafana-Loki" which is a horizontally-scalable, highly-available, multi-tenant log aggregation system inspired by Prometheus.
Loki stack consists of 3 components,
Loki - Stores logs and processing queries.
Promtail - It is an agent, to collect logs on a host and send to Loki
Grafana - To query and display the logs from Loki.
We will install this stack setup in Kubernetes cluster and view the logs.
Requirements,
Running Kubernetes Cluster
Helm installed
Step 1 :
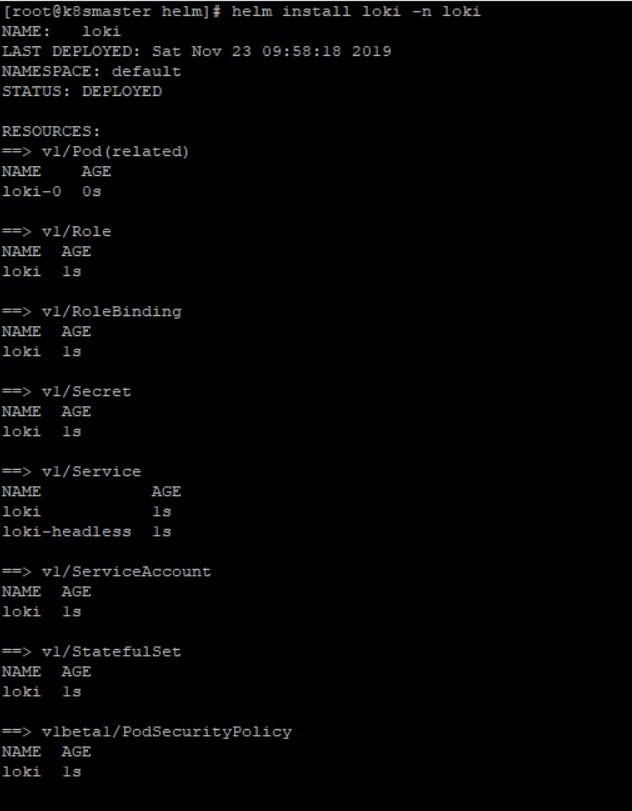
Install Loki,
# cd /tmp
# git clone https://github.com/grafana/loki.git
# cd /tmp/loki/production/helm
# helm install loki -n loki
Step 2 :
Install Promtail,
# cd /tmp/loki/production/helm
# helm install promtail -n promtail

Step 3 :
Install Grafana,
# helm install stable/grafana -n grafana

Step 4 :
Login to Grafana and configure Loki as data source,
After login to Grafana,
Choose Gear icon > choose Data Sources > Add Data Source > Choose Loki and configure it.

Step 5 :
View Logs from Loki in Grafana,
Now choose Explore icon and view the logs,


That's it, Loki has been successfully installed in Kubernetes and viewed Logs in Grafana from Loki.
Post a Comment