Dealing with multiple tools for capturing application logs from different sources can be a hassle for anyone. In this blog post, we'll dive into the steps required to establish centralized logging with Grafana Loki and Grafana Agent. This solution will allow us to unify the collection of logs from Kubernetes pods, VM services, and Azure PAAS services.
Grafana Loki : It is a highly scalable log aggregation system designed for cloud-native environments
Grafana Agent : It is an observability agent that collects metrics and logs from various application for visualization and analysis in Grafana
Requirement:
- Kuberentes Cluster (Latest version)
- Helm
- Azure PAAS(Eventhub and AKS, IOT, etc)
- VM with any application
- Azure storage account(Loki backend)
- Azure subscription with admin privileges
Step 1: Deploy Grafana loki in Kubernetes(K8s) cluster,
Ensure you have admin permission for the k8s cluster.
Before deploying Grafana Loki in k8s cluster, there are certain changes are required in the configuration.
Note : We are going to use backend as Azure Storage container in loki to store the logs and we will use Loki distributed version.
Execute below helm commands to add the Grafana repository,
Execute below command to export the Grafana Loki and Grafana agent configuration via helm,
helm show values grafana/loki-distributed > loki-values.yaml
helm show values grafana/grafana-agent > grafana-agent-values.yaml
In the loki-values.yaml, update the below configuration to use Azure storage account as backend.
schemaConfig:
configs:
- from: "2020-09-07"
store: boltdb-shipper
object_store: azure
schema: v11
index:
prefix: index_
period: 24h
storageConfig:
boltdb_shipper:
shared_store: azure
active_index_directory: /var/loki/index
cache_location: /var/loki/cache
cache_ttl: 1h
filesystem:
directory: /var/loki/chunks
azure:
account_name: === Azure Storage name ===
account_key: === Azure Storage access key ===
container_name: === Container Name ===
request_timeout: 0
Here is the loki-values.yaml.
https://github.com/DevOpsArts/grafana_loki_agent/blob/main/loki-distributed-values.yaml
Next deploy Grafana loki,
Execute below command to deploy Loki in the k8s cluster,
helm upgrade --install --values loki-distributed-values.yaml loki grafana/loki-distributed -n observability --create-namespace
Verify the pods are up and running by using below command,
kubectl get all -n observability
Now all the pods are up and running.
Step 2: Deploy Grafana agent in K8s cluster,
Deploy Grafana Agent in k8s cluster to export the k8s Pod logs to Loki
Update the grafana agent values before deploying.
Replace the grafana-agent-values.yaml file with loki distributed gateway service endpoint in line number 169 in the below file with your namespace. Currently observability is used.
https://github.com/DevOpsArts/grafana_loki_agent/blob/main/grafana-agent-values.yaml
loki.write "local" {
endpoint {
url = "http://loki-loki-distributed-gateway.observability.svc.cluster.local/loki/api/v1/push"
}
}
In the grafana-agent-values.yaml, Currently it is added to export k8s pod logs, k8s events, etc.
Next deploy Grafana-Agent using below command,
helm install --values grafana-agent-values.yaml grafana-agent grafana/grafana-agent -n observability
Verify the pods are up and running by using below command,
kubectl get all -n observability
Now you can go to azure storage account which is configured in Grafana Loki and verify the logs are getting updated to the respective container.
Step 3: Deploy Grafana, to view the pod logs
Execute below command to install Grafana in K8s cluster,
helm install grafana grafana/grafana -n observability
Verify the pods are up and running by using below command,
kubectl get all -n observabilityuse below command to get the password for Grafana,
kubectl get secret --namespace observability grafana -o jsonpath="{.data.admin-password}" | base64 --decode ; echo
Step 4: Access Grafana and view the pod logs
Use port forward or use NodePort or Ingress to access the Grafana Dashboard.
- Configure loki as Datasource in Grafana,
Once login to the Grafana, Go to Home > Connections > Search for "Loki", then select it.

Next give connection url as,
http://loki-loki-distributed-gateway.monitoring1.svc.cluster.local
then select save and test.
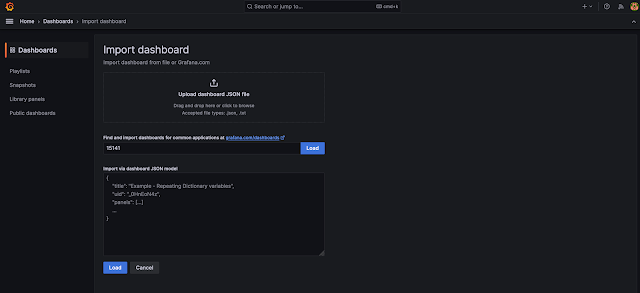
- Next import Loki dashboard,
Go to Grafana Home > Dashboard > select New and Import.
Use this below Grafana template ID "15141" , load it and save it.
https://grafana.com/grafana/dashboards/15141-kubernetes-service-logs/?source=post_page-----d2847d526f9e--------------------------------
Next click the dashboard, You can able to view all the pod logs now.
Step 5: View the Kubernetes(K8s) Events in Grafana,
To view the Kubernetes events, Go to Grafana Home page > Explore > Select "Datasource name" > Select "Job" and value as "loki.source.kubernetes_events"
In this part, We have covered how to deploy Grafana Loki with Azure Storage as the backend, deployed Grafana Agent to view Kubernetes pod logs, and deployed Grafana dashboard to visualize the pod logs and Kubernetes events.
In the next Part 2, We will explain how to configure Grafana Agent for VM applications and send the logs to the same Grafana Loki.
Part 3 : We will cover how to export Azure PAAS services logs to Grafana Loki


Hey brother, Thank you it was helpful
ReplyDeletePost a Comment