Logs are more important to understand, what is happening inside the Kubernetes cluster.
In this blog we will see how to manage/view the logs of Kubernetes cluster and running pods using EFK(Elasticsearch Fluentd Kibana) Stack.
Elasticsearch : It is an Opensource document-oriented database, It stored the data in json format, easy to use, scalable.
Fluentd : It is an open source data collector for logging, it runs in the background to collect, parse, transform, analyze and store various types of data.
Kibana : It is a visual interface tool that allows you to explore, visualize, and build a dashboard over the log data from Elasticsearch.
Requirements :
Kubernetes cluster
helm
My environment details,
Cluster setup : 1 master and 1 node
Kubernetes version : 1.18
Helm version: 2.16.9
Step 1:
Install Elasticsearch in kubernetes,
Use below helm command to install Elasticsearch and make sure you have enough resources in your cluster to install Elasticsearch because it consumes more resources.
# helm install -n elasticsearch stable/elasticsearch
Note : its use persistent volume.

Wait for few minutes until all the pods are Running.
to check the pod status,
# kubectl get pods

Here we can see all the Elasticsearch pods are Running state.
Step 2 :
Install Fluentd,
Use below helm command to install fluentd.
# helm install -n fluentd stable/fluentd-elasticsearch

After executed fluentd helm install, we will check the status of the pod,

The Fluentd pod is running fine, During this time in Elasticsearch we can see the Indices status, whether any indices is created or not by curl command.
# curl '10.244.1.44:9200/_cat/indices?v'
Above IP is belongs to any one Elasticsearch-client pod.
We can see one indices is created with the name of "logstash-2020.07.05" and the docs.count value also increasing. Then Fluentd is working fine.
Step 3 :
Install Kibana,
By default Kibana will use service name as elasticsearch:9200 to connect Elasticsearch but for us the service name is, elasticsearch-client:9200 to change this we need to create a value file to overwrite the default service name,
create a file kibana-values.yaml and save the below data,
# vi kibana-values.yaml
files:
kibana.yml:
server.name: kibana
server.host: "0"
elasticsearch.hosts: http://elasticsearch-client:9200
service:
type: NodePort # Am using NodePort to access kibana
Save and close the file.
Now run helm command to install Kibana,
# helm install -n kibana stable/kibana -f kibana-values.yaml

Next wait for few minutes until the kibana pods comes up.

Now we can see the Kibana pod is in Running state and we can see all the required pods are running fine in Kubernetes cluster.
Will check the helm list to view the installed helm charts,
# helm list

Step 4:
Access Kibana,
To access kibana, I have given NodePort in the kubernetes service while installing Kibana, Will check the port number and access the Kibana from browser,
# kubectl get svc

Here the port number for kibana is, 31489, we will use this port number to access Kibana dashboard.
URL : http://KubernetesIP:31489

Next we need to create IndexPattern to view the logs in Kibana.
Go to management > Click IndexPattern > enter "logstash"

If the indices was created already by fluentd, we can see it in the Step 1 of Index Pattern.Next choose the timestamp option and click Create index pattern.

Next click Discover icon, we can see all the pods log here,

If we want to see any specific pod logs, in the search section give as, kubernetes.pod_name: pod_name.
eg : kubernetes.pod_name: kibana

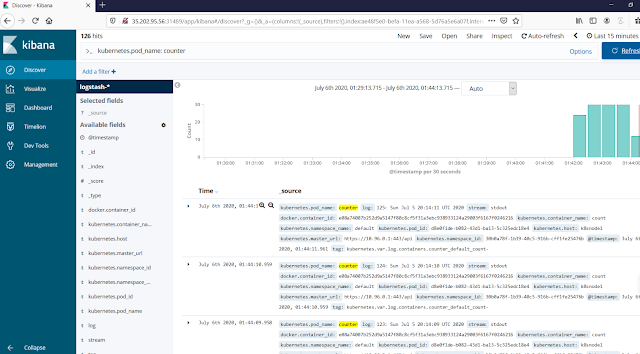
Next we will create a new pod and we will see the logs are coming in Elasticsearch and view from Kibana.
Execute this below kubectl command, it will create a test pod and generate the logs,
# kubectl apply -f https://k8s.io/examples/debug/counter-pod.yaml

From the above image we can see the logs are generated for the test pod, we will check it in Kibana now,

Here I have searched only for pod name "Counter" and able to view the logs.
That's it, We have successfully installed EFK in Kubernetes cluster via helm and viewed the logs from Kibana.

Post a Comment