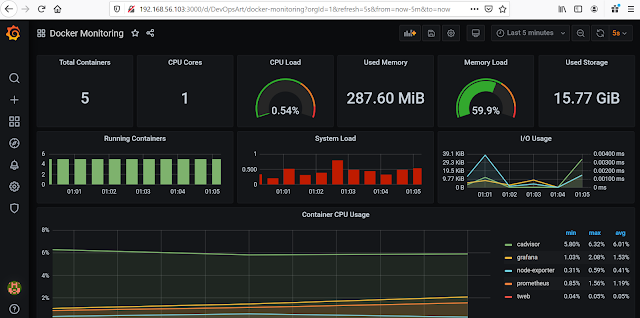
In this blog we will see step by step to install Cadvisor, NodeExporter, Prometheus, Grafana to monitor docker containers and its hosts.

Note : We are going to use only docker images for all the tools.

Requirements:

Docker running Linux server :  1

Step 1:

Deploy Cadvisor in docker:

Cadvisor : It provides container resource usage and performance characteristics of their running containers.

Execute the below docker command in linux server,

# docker run -d -p 8080:8080 -v /:/rootfs:ro -v /var/run:/var/run:rw -v /sys:/sys:ro -v /var/lib/docker/:/var/lib/docker:ro --name=cadvisor google/cadvisor:latest

We can access Cadvisor in browser by http://server-IP:8080

Step 2:

Deploy Node-Exporter in docker:

Node-Exporter : It helps to measure various machine resources like as CPU, memory, disk and network utilization.

Execute the below docker command in linux server,

# docker run -d -p 9100:9100 --name=node-exporter prom/node-exporter

We can access Node-Exporter metrics in browser by http://server-IP:9100/metrics


Step 3:

Deploy Prometheus in docker:

To deploy Prometheus, we need to create configuration file for prometheus like below,

#vi /root/config/prometheus.yml

global:

  scrape_interval: 15s

  evaluation_interval: 15s

scrape_configs:

  - job_name: 'prometheus'

    static_configs:

    - targets: ['Host-IP:9090']

      labels:

        alias: 'prometheus'

  - job_name: 'cadvisor'

    static_configs:

    - targets: ['Host-IP:8080']

      labels:

        alias: 'cadvisor'

  - job_name: 'node-exporter'

    static_configs:

    - targets: ['Host-IP:9100']

      labels:

        alias: 'node-exporter'


Save the file.

Here Cadvisor, Node-exporter metrics details are given.

Now run the Prometheus docker command,

# docker run -d -p 9090:9090 -v /root/config/prometheus.yml:/etc/prometheus/prometheus.yml --name=prometheus prom/prometheus

We can access Prometheus metrics in browser by http://server-IP:9090/metrics

We can check the targets are up or not in Prometheus by http://server-IP:9090/targets

Step 4:

Deploy Grafana in docker:

Execute the below docker command in linux server,

# docker run -d -p 3000:3000 --name=grafana grafana/grafana:latest


We can access Grafana in browser by http://server-IP:3000


To login Grafana, the default user name and password is "admin".

Once login to grafana we need to add datasource as Prometheus in grafana.

Go to configuration > datasources > Add data source > Select Prometheus > Give name for datasource and enter the Prometheus URL which we got it from step 3 eg : http://server-IP:9090


Now click Save&Test and it should show like above image after click Save&Test.

Next import the below Grafana dashboard json from the link or you can manually create the dashboard.

https://docs.google.com/document/d/1CDwcNQ_0UuPLlkRDSJvgAtILcKc4DZfl8EueMgg8tY4/edit?usp=sharing

Click "+" icon from left side and then choose "import" and copy and past the above link json inside the box below "Import via panel json" and load it and click "import".


Now open the dashboard and we can see the docker container status and docker host status.


Currently we are running totally 4 docker containers and it is showing correctly in dashboard,


Step 5:

Next we will check the monitoring is working or not by deploying a test web in docker,

Execute the below docker command in linux server,

# docker run -d -p 80:80 --name=tweb yeasy/simple-web:latest


Now wait for few minutes, it will take few minutes to reflect in Grafana dashboard.


Great!!! Now we can see the new docker container is reflecting in Grafana dashboard.

That's all we have successfully deployed Cadvisor, Node-Exporter, Prometheus and Grafana to monitor docker container and docker hosts.

Post a Comment

Previous Post Next Post