Kube-green: This Kubernetes(k8s) operator enables the shutdown of environments or specific resources, allowing for optimal resource utilisation and minimising energy waste. It helps to bring up/down deployments and cronjobs.
Requirements:
K8s cluster (min. version 1.19) (I Am using version 1.25.4)
Step 1: Install kube-green,
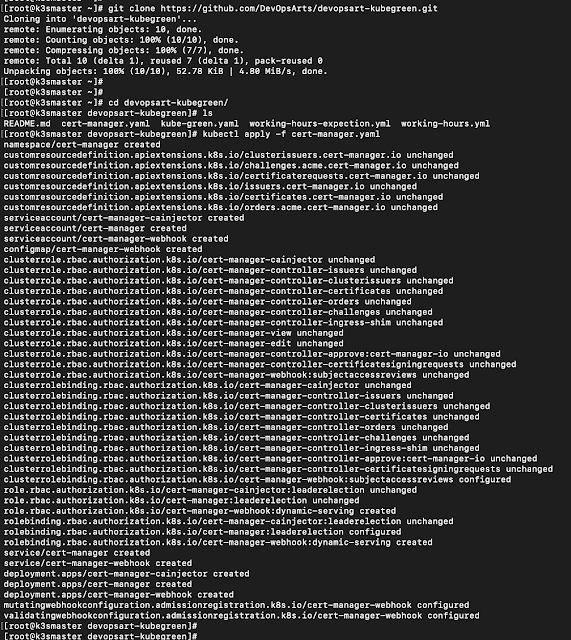
Clone the below repo which has all the configuration details,
git clone https://github.com/DevOpsArts/devopsart-kubegreen.git
cd devopsart-kubegreen
Install cert-manager,
kubectl apply -f cert-manager.yaml
Install kube-green,
kubectl apply -f kube-green.yaml
Get all resources related to kube green by,
kubectl get all -n kube-green
Step 2: Deploy Nginx web for validation using helm,
helm repo add bitnami https://charts.bitnami.com/bitnami
helm install nginx-web bitnami/nginx
kubectl get pods
Now Nginx pod is up and running in the k8s cluster
Step 3: Configure kube-green
We will scale down and up the nginx web using kube-green,
Go to the same git cloned folder and update the timing and deployment namespace details,
https://github.com/DevOpsArts/devopsart-kubegreen/blob/main/working-hours.yml
cd devopsart-kubegreen
cat working-hours.yml
apiVersion: kube-green.com/v1alpha1
kind: SleepInfo
metadata:
name: working-hours
namespace: default
spec:
weekdays: "1-5"
sleepAt: "08:40"
wakeUpAt: "08:42"
timeZone: "Etc/UTC"
Update the bold letters according to your requirements, and it will scale down and up all the deployments in the cluster.
The screenshot below shows how it worked. The pod was scheduled to scale down at 8:40 AM UTC and scale up at 8:42 AM UTC, and it scaled down at 8:40 AM UTC according to the configuration.
Below configuration will help to scale down the pods with exceptions.
https://github.com/DevOpsArts/devopsart-kubegreen/blob/main/working-hours-expection.yml
We can check the kube-green logs from kube-green pods for scale down/up status,
kubectl get pods -n kube-green
kubectl logs -f kube-green-controller-manager-6446b47f7c-hbmtx -n kube-green
Step 4: Kube-green monitoring,
We can monitor the resource utilization of the Kube Green resources and check the status of pod scale-down and scale-up. Kube Green exposes Prometheus metrics on port number 8080 with the /metrics path. We can configure it in Grafana to monitor the status.
That's all. We have deployed Kube-Green in the K8s cluster and validated it by scaling down and up.
Reference,


Post a Comment