
Prerequisites :
OS : CentOS 7.6


OS : CentOS 7.6
Step 1 :
Disable SELinux,
#vi /etc/sysconfig/selinux
change "SELINUX=enforcing" to "SELINUX=disabled"
Reboot the server.
#vi /etc/sysconfig/selinux
Reboot the server.
Step 2 :
Add Grafana YUM repository,
#vi /etc/yum.repos.d/grafana.repo
[grafana]
name=grafana
baseurl=https://packages.grafana.com/oss/rpm
repo_gpgcheck=1
enabled=1
gpgcheck=1
gpgkey=https://packages.grafana.com/gpg.key
sslverify=1
sslcacert=/etc/pki/tls/certs/ca-bundle.crt
Save and exit.
Step 3 :
Step 3 :
Install Grafana,
#yum install grafana -y


Step 4 :
Start grafana service,
#systemctl start grafana-server
#systemctl status grafana-server


Enable Grafana service on system boot
Step 5 :
Access Grafana Web interface,
Default Grafana port is 3000, so allow in your firewall to access from outside.
http://Your Server IP or Host Name:3000/login


Default Grafana user name - admin and password - admin, Next it will ask you to change the password, give the new password and save it.
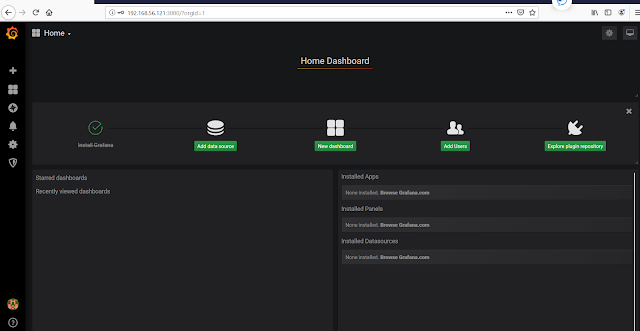

Thats it, Grafana is installed successfully.
Next step, add data sources like Prometheus, Elasticsearch, influxdb,etc and explore the metrics.
List of available Grafana Dashboard - https://grafana.com/grafana/dashboards
Post a Comment