
What is Hypertrace: It is a cloud-native distributed tracing based observability platform that gives visibility into any environment distributed system. It converts distributed trace data into relevant insight for everyone.
Hypertrace supports all standard instrumentation libraries and agents. If your application is already instrumented with OpenTelemetry, Jaeger or Zipkin, Hypertrace will work out of the box with your application telemetry data.
Requirements:
- Docker engine & Docker compose
Step 1: Clone and Install hypertrace,
# git clone https://github.com/hypertrace/hypertrace.git
# cd hypertrace/docker
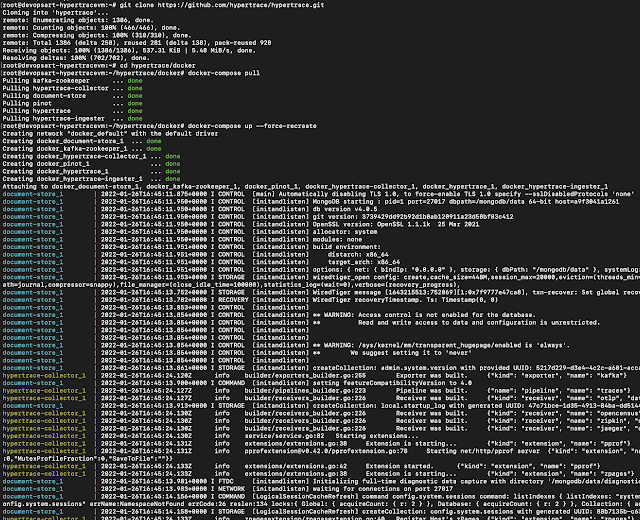
# docker-compose pull
# docker-compose up --force-recreate
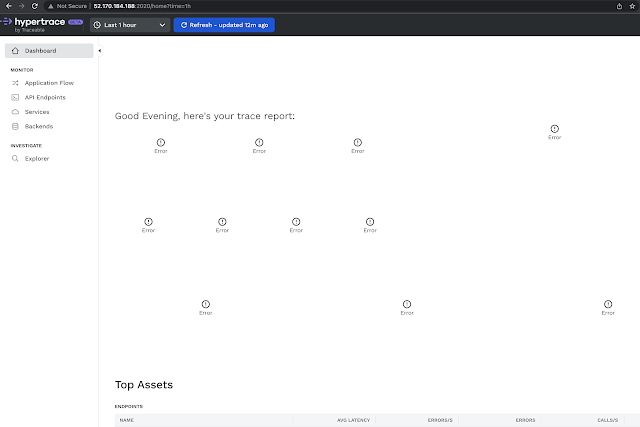
Step 2: Access Hypertrace Dashboard
Once step 1 is completed successfully, We can access the Hypertrace dashboard from the browser.
URL: http://IP of the VM:2020
Step 3: Sample Application test with Hypertrace
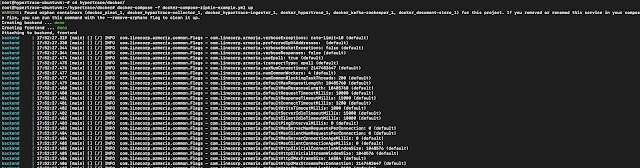
The above-cloned repo is having a sample application which is having frontend and backend APIs and it sends data to Zipkin. Let's check that.
# cd hypertrace/docker
# docker-compose -f docker-compose-zipkin-example.yml up
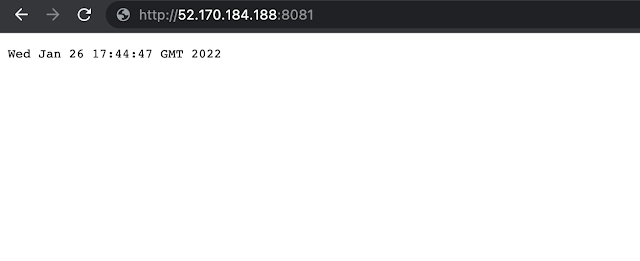
Once the containers are up, we can check the frontend in the browser by,
URL: http://IP of the VM:8081
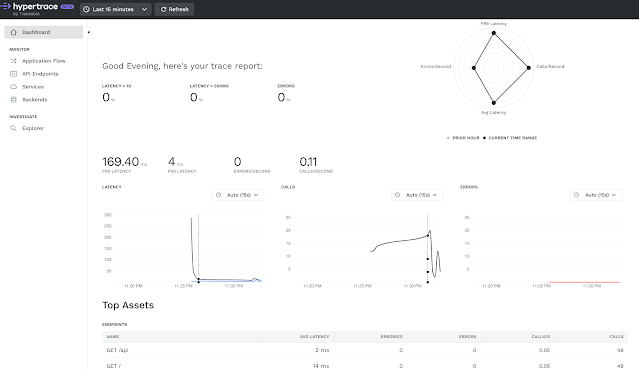
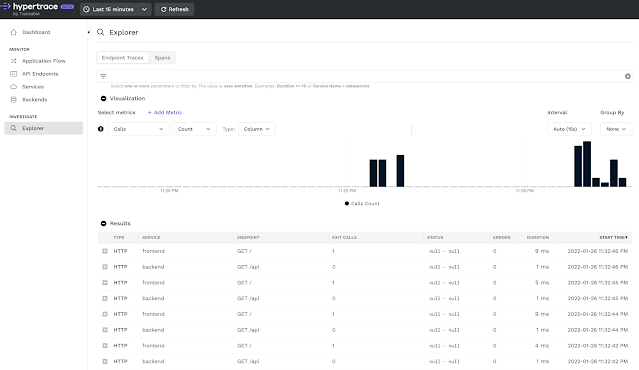
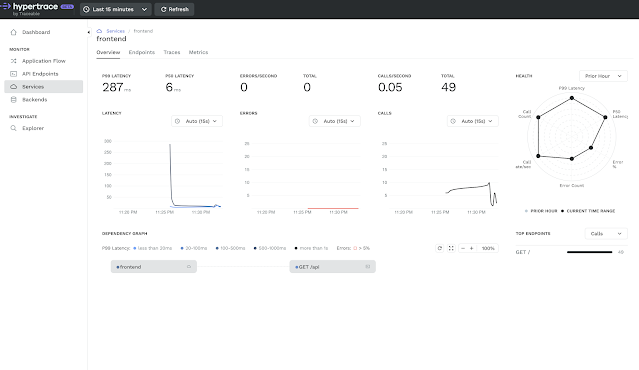
Step 4: View the metrics in Hypertrace
Hit the frontend URL multiple times and see Hypertrace dashboard to see the data.
We can see the list of APIs, Errors, latency, etc. Here are few screenshots.


Ref. : https://github.com/hypertrace/hypertrace
https://docs.hypertrace.org/
Post a Comment